Get With The Times
I love a good piece of vintage gear as much as the next guy. I have a soft spot for the Ivie IE-30A — that little black box was genuinely impressive engineering for its time. I have carried one into more booths than I can count. But there is a difference between respecting the tool that got us here and pretending it is still the right tool for the job. One is appreciation. The other is denial.
In the cinema audio world, we have a denial problem.
Walk into many cinema projection booths today — many, from a 14-plex in the suburbs and even to a few flagship PLF auditoria — and you will find the same workflow we were using in 1985. A technician locked inside the projection booth, Ivie IE-30A in hand, blasting pink noise and staring at 31 LED bars like they are going to tell him something useful. And here is the part that should bother everyone: the best diagnostic tool that technician owns — his ears — is completely useless in the booth. He is acoustically isolated from the very room he is trying to calibrate. He cannot hear what the audience hears. He cannot hear the room modes, the flutter echoes, the bloated bass, or the harsh midrange. He is making decisions about a room he cannot hear, using a tool that cannot see, and calling it a calibration. Meanwhile, the live sound world, the studio world, and the automotive audio world all packed up their RTAs and moved on twenty years ago. They use Smaart. They use REW. They use swept sine measurements and parametric EQ. They have been doing it so long they have forgotten it was ever any other way.
We are the last holdouts. And it is costing our audiences every single day.
This article is for the cinema techs and audio engineers who are ready to have an honest conversation about why our measurement and correction tools are failing us, what the modern alternatives actually offer, and why — after all of that — the most important piece of test equipment you own is still the one attached to the sides of your head.
The Pink Noise RTA Illusion
You already know what pink noise is. You have been using it your whole career. Equal energy per octave, flat on the RTA when averaged properly, excellent for setting reference levels and verifying that all your channels are alive and pointed in the right direction. As a starting point for cinema calibration, pink noise with a 1/3-octave RTA is perfectly fine. I am not here to take away your pink noise. I am here to tell you that it is the starting point — not the finish line — and that the cinema industry has been treating it as both for forty years.
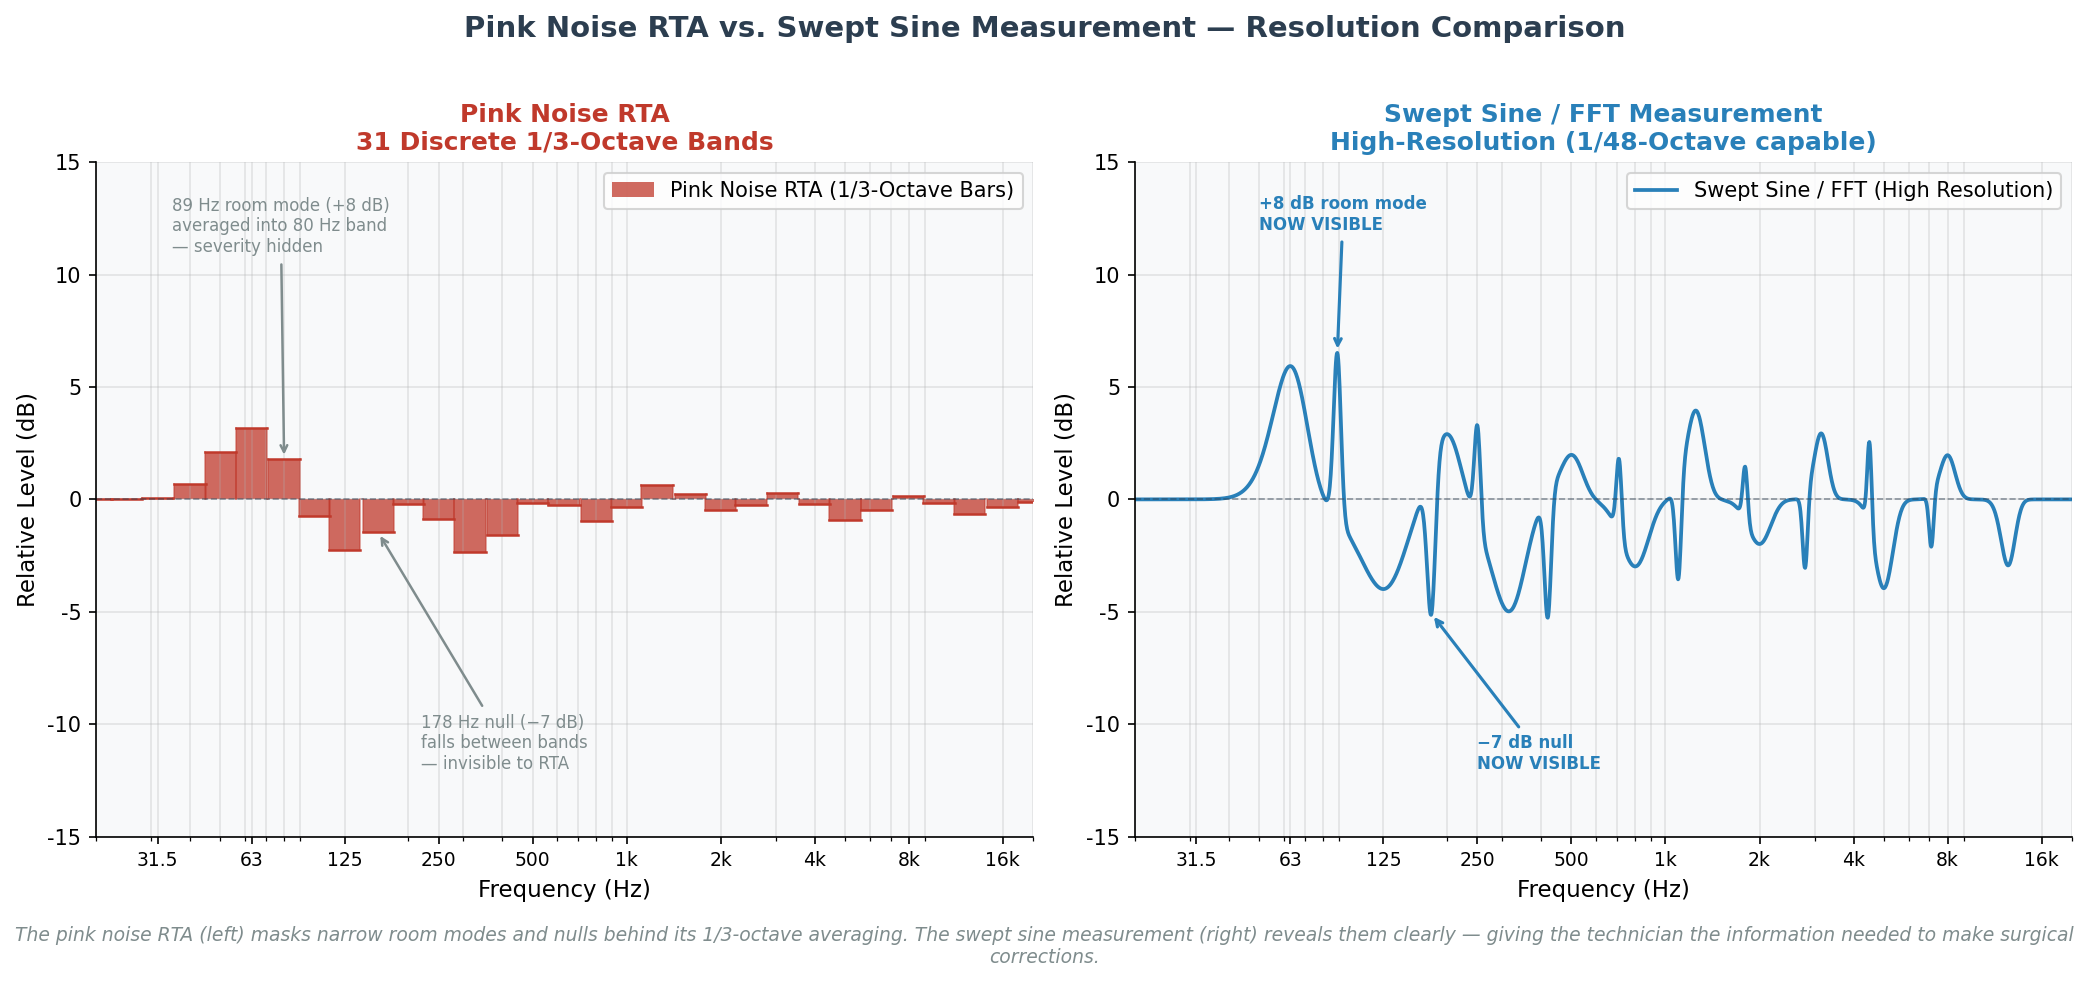
Here is the problem: a 1/3-octave RTA is essentially a very expensive averaging machine. It takes everything happening in a 1/3-octave slice of the spectrum, adds it all together, and gives you one number. That number tells you the average energy in that band. It does not tell you what is actually happening inside the band. And rooms do not produce nice, smooth, well-behaved averages. Rooms produce chaos — sharp resonances, narrow nulls, comb filtering, modal ringing — and the 1/3-octave RTA smooths all of that chaos into a pretty, misleading picture.
In fact, Ivie's own IE-30A manual opens the pink noise section with this line: "When is pink noise flat? Never!" The people who built the tool told you it had limitations. The question is whether we have been paying attention.
Here is a scenario every cinema tech has lived through. You measure the room, the trace looks reasonably smooth, you make a few tweaks, you call it good. Then the movie plays and the bass sounds simultaneously bloated and hollow — like someone stuffed a pillow inside a cardboard box. The audience complains. The manager turns the fader down to 5.5. The problem is still there, just quieter. Nobody knows why, because the RTA said the room was fine. What the RTA did not tell you is that there was a +8 dB room mode at 89 Hz and a −7 dB null at 178 Hz sitting right next to each other — and the 1/3-octave averaging made them cancel each other out on the display. The room was lying to you, and the analyzer was helping it do it.
Swept Sine vs. Pink Noise: The Signal-to-Noise Advantage
Here is another problem with pink noise that every cinema tech has experienced but maybe never articulated: you are not just measuring the room. You are measuring the room plus the HVAC system, plus the truck idling in the parking lot, plus the popcorn machine in the lobby that the manager refuses to move, plus whatever is happening in auditorium 7 next door. Pink noise measurement is real-time, which means every piece of acoustic garbage in the building gets averaged right into your trace. You are not measuring the room. You are measuring the room's confession under duress.
A swept sine measurement — the kind that Smaart and REW use in their Impulse Response mode — works on completely different principles. The software sends a precise sine wave that sweeps from 20 Hz to 20 kHz over a few seconds. It knows exactly what it sent and exactly when it sent it. When it compares the recorded response against the original signal, it can mathematically strip out almost all the background noise, because the background noise does not correlate with the sweep. The result is a dramatically higher signal-to-noise ratio. You can get a clean, high-resolution measurement of a cinema auditorium with the HVAC running, the projector cooling fans spinning, and the building doing whatever buildings do. The swept sine does not care. It is only listening for its own signal.
But the real reason to use swept sine is not noise rejection. It is time domain data — and this is where things get genuinely exciting if you are a cinema audio person.
A pink noise RTA tells you how loud a frequency is. That is all it tells you. A swept sine impulse response tells you when that frequency arrived. That is an entirely different dimension of information. It tells you if your subwoofers are arriving at the audience seats 14 milliseconds late relative to the screen channels — which means every explosion in every movie is slightly smeared in time, and nobody in the building knows why it sounds a little off. It tells you if you have a flutter echo bouncing between the back wall and the screen. It tells you your RT60 decay times at every frequency. It shows you phase alignment across your entire system. An RTA is a blurry photograph of the room. A swept sine impulse response is a complete medical workup.
The 31-Band GEQ: A Blunt Instrument
So now you have a high-resolution swept sine measurement and you can actually see what the room is doing. You have a nasty room mode at 250 Hz. You know it is narrow and sharp. You know exactly where it is. Now you reach for the 31-band GEQ to fix it. And this is where the second tool in the legacy toolbox lets you down just as badly as the first one.
The 31-band GEQ has fixed frequency bands. You cannot move them. You cannot change their width. Every single filter on that unit has a Q of approximately 4.3 — which means when you pull the 250 Hz slider down 7 dB, you are not just cutting 250 Hz. You are cutting a wide swath that reaches all the way into 200 Hz and 315 Hz. Those frequencies were perfectly fine. They did nothing wrong. But they are collateral damage now, because the GEQ does not do surgical. The GEQ does carpet bombing. You traded one problem for three, and the room sounds worse in a different way than it did before. Congratulations on your fix.
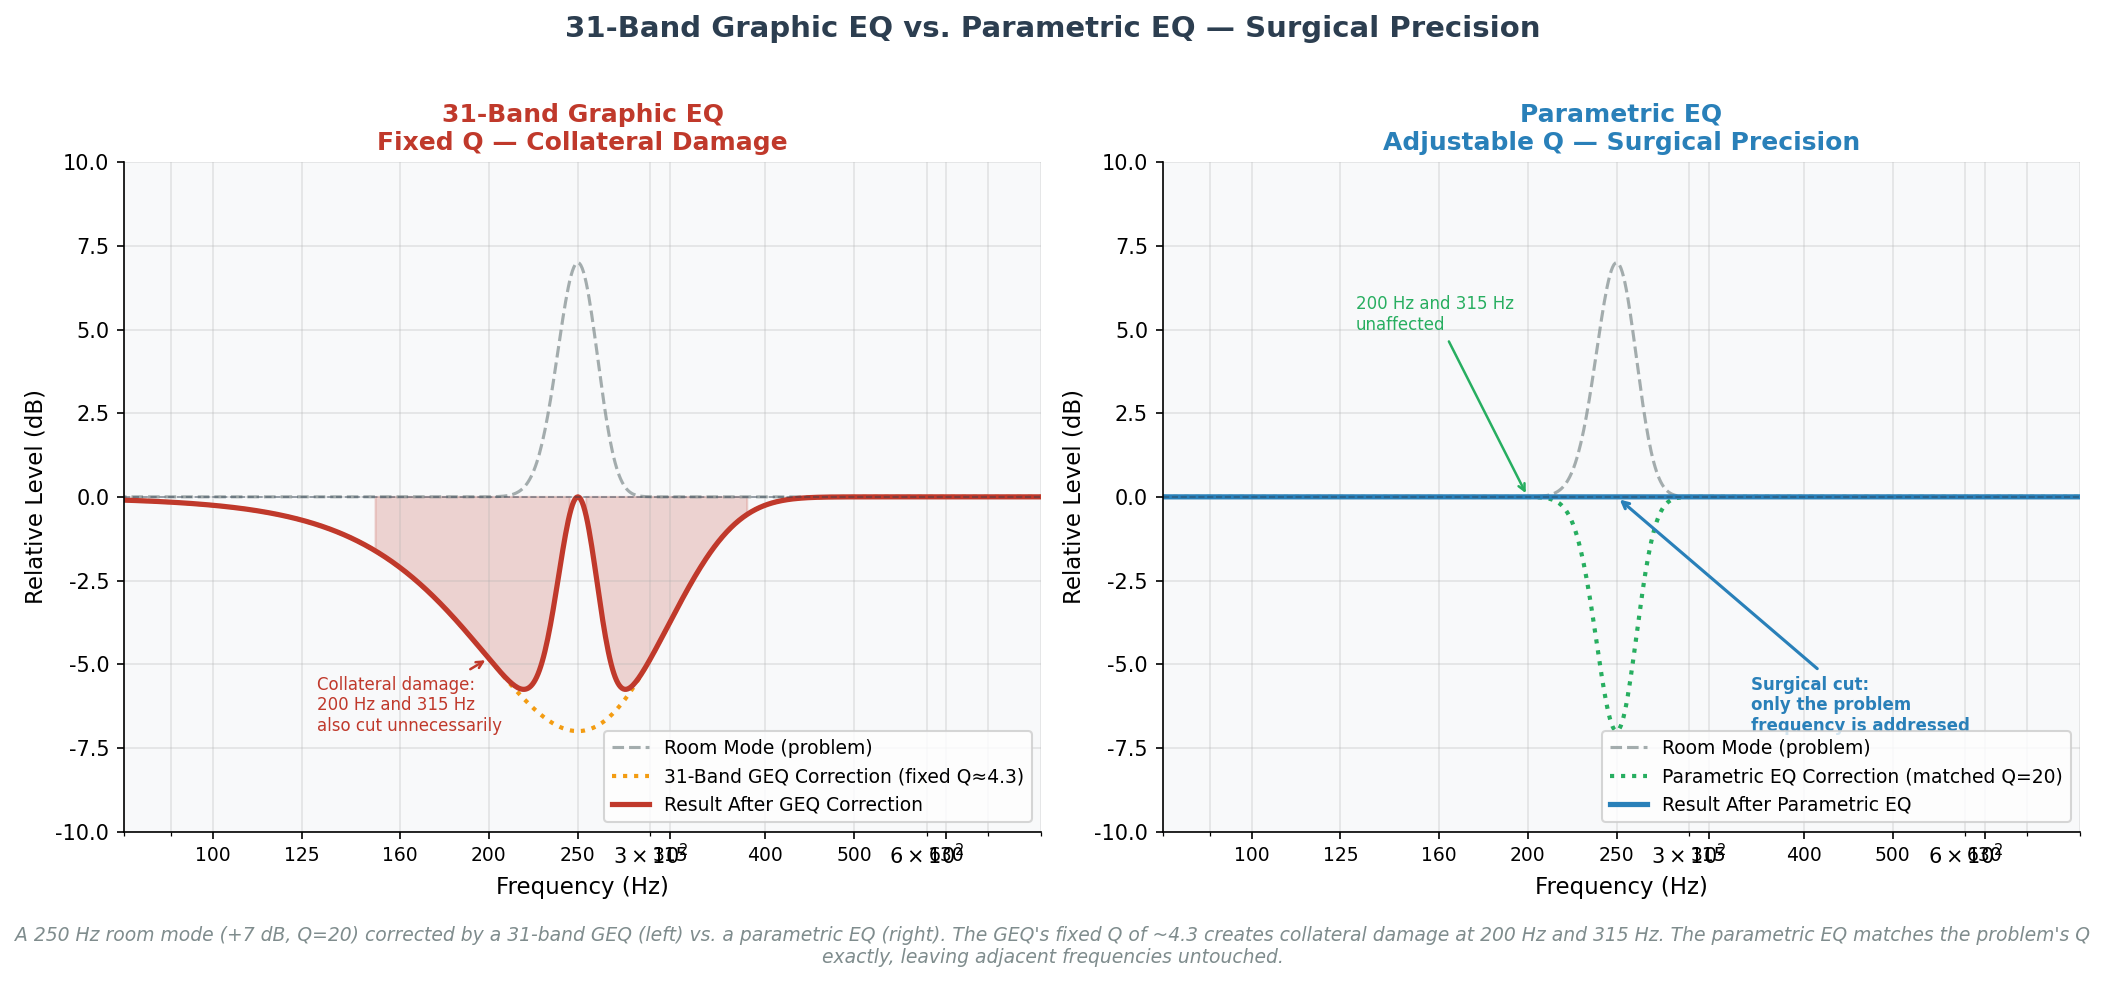
A Parametric EQ — the kind that is already built into your Dolby CP950, your QSC DCP-300, your Barco Alchemy, and virtually every modern cinema processor — gives you three controls: center frequency, cut depth, and Q. You dial the center frequency to exactly 250 Hz. You set the Q to match the shape of the room mode. You cut it the right amount. Done. The problem is gone. The frequencies on either side are completely untouched. That is what surgical correction looks like. The tool is already in your rack. You just have to use it.
The "Between the Bands" Trap
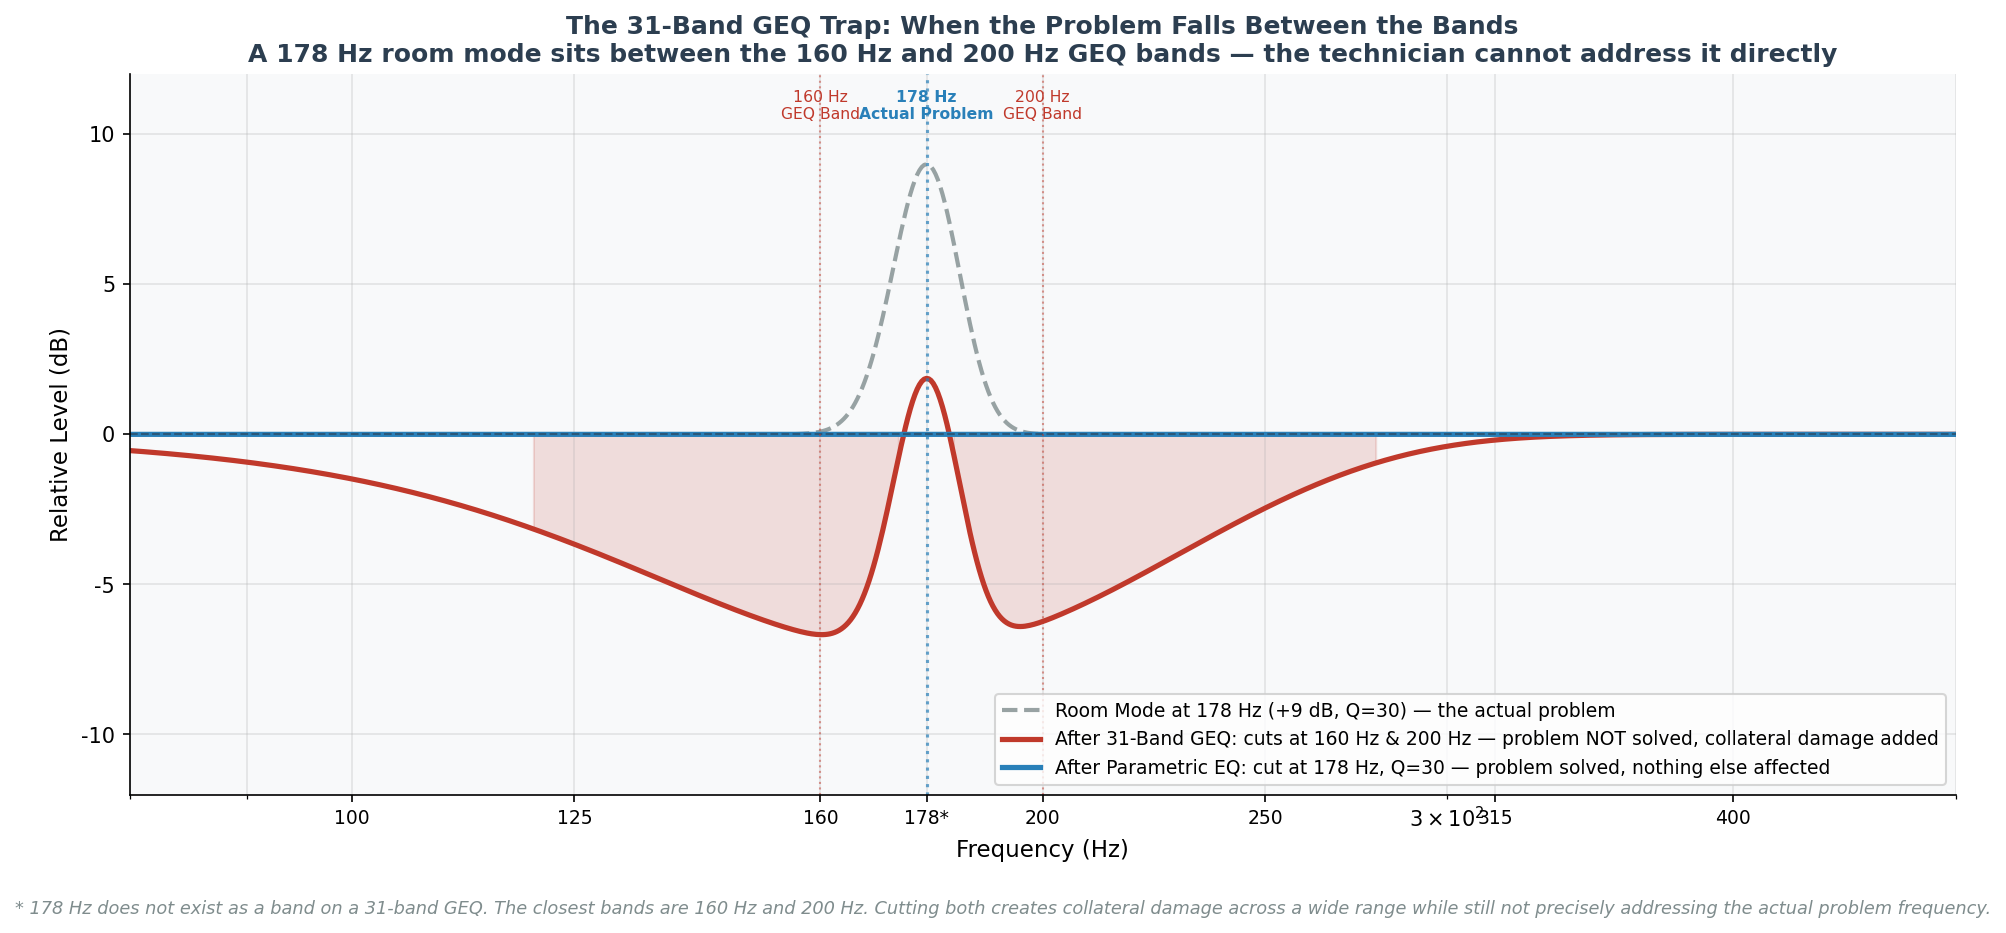
It gets worse. The GEQ becomes completely useless when the problem does not land on one of its 31 fixed frequencies — which is most of the time, because rooms are not designed by the same committee that decided on ISO 1/3-octave center frequencies. Rooms do what they want.
Suppose your swept sine measurement shows a room mode at 178 Hz. Go ahead and look at your 31-band GEQ. There is no 178 Hz slider. The closest options are 160 Hz and 200 Hz. So now you have two bad choices: cut 160 Hz, cut 200 Hz, or cut both. If you cut both, you have just carved a massive crater in the low-midrange — the exact frequency range where male dialogue lives, where the warmth of a film score lives, where the body of a cinema soundtrack lives. You have sucked the life out of the sound to address a problem the GEQ could not even reach directly. The room mode at 178 Hz is still there, slightly reduced, but now you have three new problems instead of one. And the technician who did this will never know, because the pink noise RTA will show a nice flat trace and everyone will go home happy until the first screening.
Live sound engineers figured this out twenty years ago and stopped using graphic EQs for room correction entirely. They use parametric EQ now. Studio engineers use parametric EQ. Broadcast engineers use parametric EQ. The cinema industry is the last professional audio discipline still reaching for the 31-band slider board as its primary correction tool. And the punchline is that we do not even need to buy anything new. The parametric EQ is already sitting in the cinema processor in the rack. It has been there for years. We just have not been using it.
What Your Analyzer Actually Tells You
Let's put the tools side by side and be completely honest about what each one actually delivers — because I think a lot of cinema techs have never seen this comparison laid out plainly. The IE-30A was a great tool. It is not a great room analysis tool in 2026. That is not an insult to Ivie. It is just physics and forty years of progress.
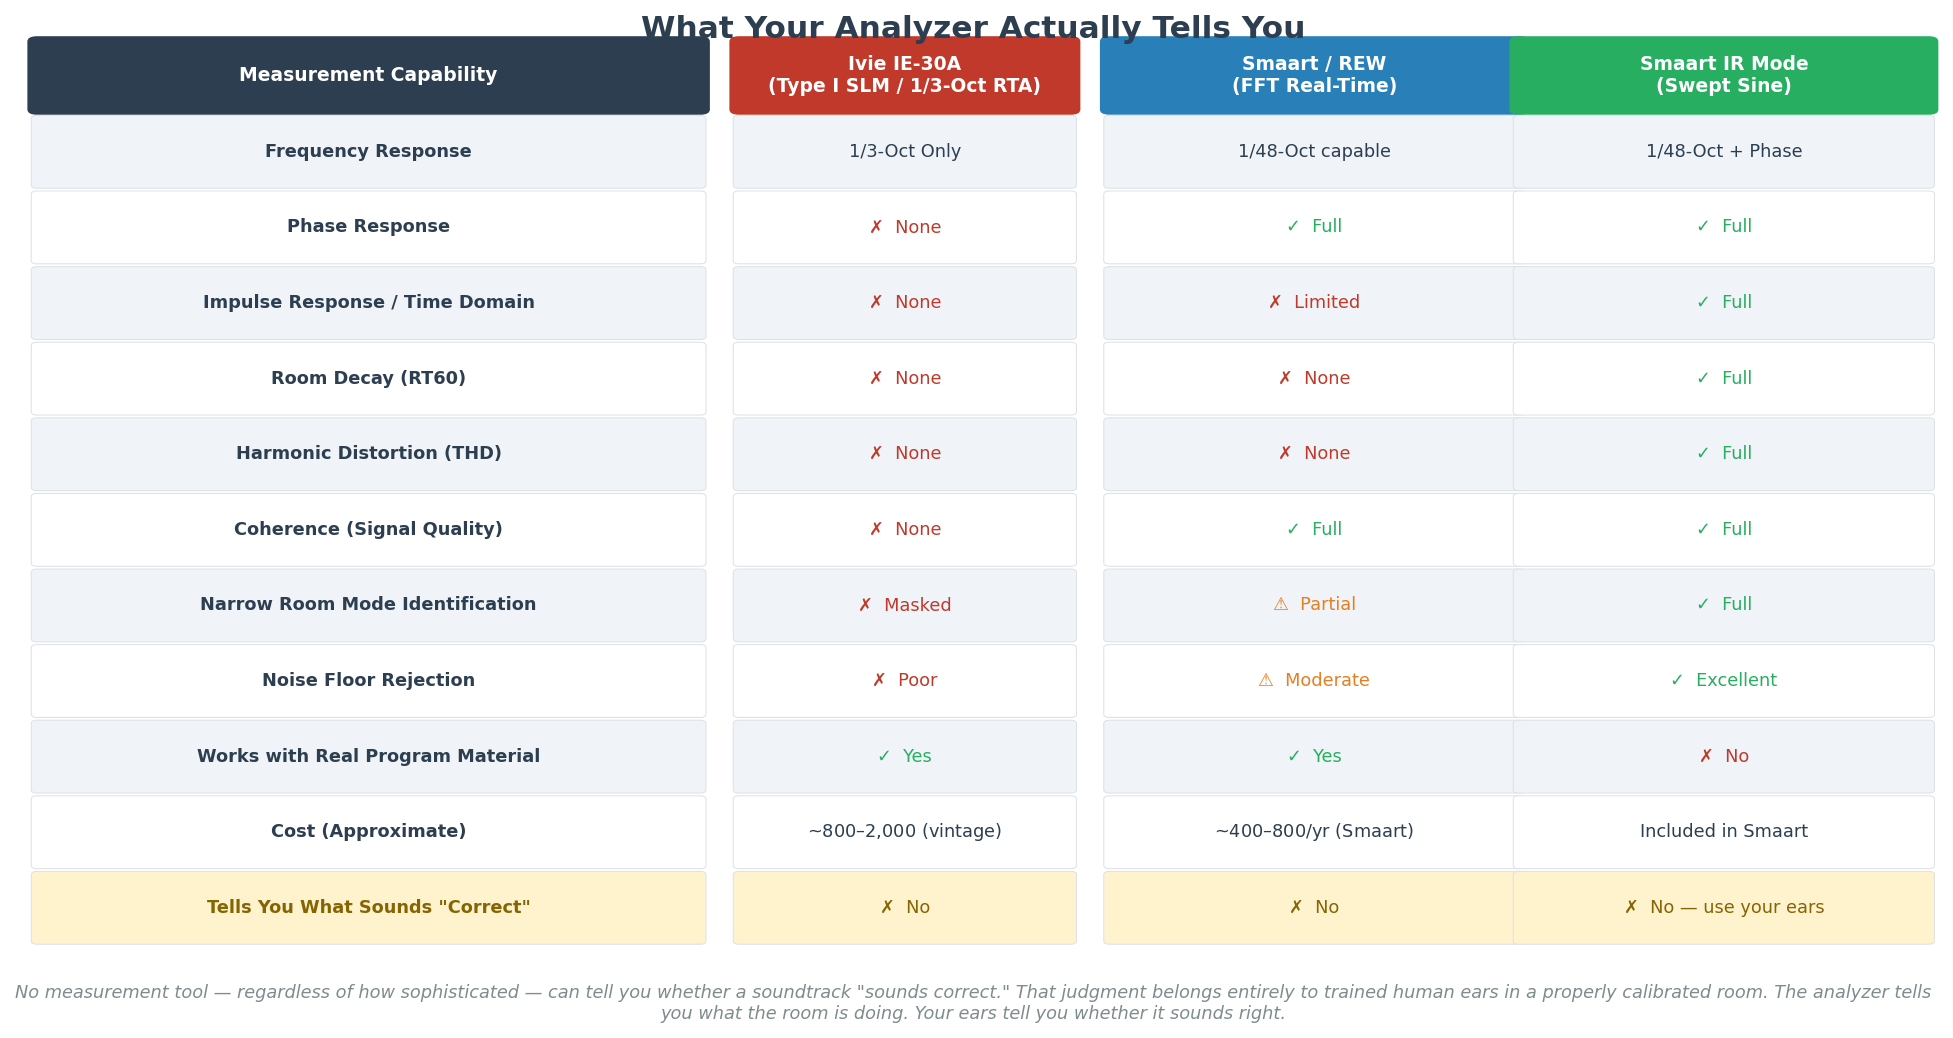
Look at that bottom row. Every tool in the table — the vintage IE-30A, the modern Smaart FFT, the swept sine impulse response — gets the same answer: No. None of them can tell you what sounds correct. That is not a limitation of the tools. That is a feature of human hearing. And it is the most important thing to understand before you spend six hours chasing a flat line on a laptop screen.
The Final Truth: Your Ears Are the Only Judge
Here is the great irony at the center of this entire argument: I have just spent several pages making the case for better measurement tools, higher resolution analysis, and more precise EQ. And now I am going to tell you that none of it matters if you forget to use your ears.
An analyzer is a diagnostic tool. Think of it as an X-ray machine. An X-ray can tell you there is a fracture at a specific location. It cannot tell you how much pain the patient is in. It cannot tell you if the patient is going to be okay. It gives you data. You are the doctor. The cinema is the patient. The audience is the one who tells you whether the treatment worked.
I have watched technicians — good technicians, experienced technicians — spend six hours in front of a laptop screen tweaking parametric filters until the Smaart trace is perfectly, beautifully flat. They are proud of that trace. They should be. It is a work of art. Then they play a movie and it sounds like a wet cardboard box. A flat frequency response is almost never the correct target for a cinema. And the proof of that is written into the very foundation of the standard we calibrate to every day.
Let me tell you the story of the X-curve, because it is the most important argument for trusting your ears that this industry has ever produced.
In 1971, a Dolby engineer named Ioan Allen was working at Elstree Studios in England on the post-production of Stanley Kubrick's A Clockwork Orange. Allen was frustrated with the limited bandwidth and high distortion of the optical soundtrack playback system of the era. He set up an experiment: near-field KEF monitors close to the mixing console, and the far-field cinema loudspeakers at the back of the large dubbing stage. He equalized the far-field speakers to achieve the best possible timbre match with the near-field sound — which he knew to be accurate. What he was looking for was the frequency response that made a large cinema speaker sound like a flat, accurate monitor.
What he found surprised him. In his own words, from his 2006 SMPTE paper on the X-curve's history:
“A surprising development was the discovery that the best subjective match still showed an apparent slight HF droop. A slope of around 3 dB per octave from about 2 kHz seemed to give the best results.”
He did not derive that slope from a formula. He did not calculate it from a measurement target. He found it with his ears. He listened to the room, adjusted the equalization until it sounded right, and then measured what he had done. The 3 dB per octave high-frequency slope — the defining characteristic of what would eventually become the X-curve, standardized as ISO 2969 and SMPTE 202M — was discovered by a human being listening to a room and deciding what sounded correct.
Allen later developed the psychoacoustic explanation for why the curve works: most cinema dialogue consists of short-duration transients — consonants like “t,” “p,” and “d” — that arrive at the listener’s ears before room reverberation has time to build up. If you tune a large cinema flat with pink noise, those first-arrival transients will have a rising high-frequency characteristic, which sounds harsh and fatiguing. The 3 dB per octave slope corrects for this. The X-curve is not a compromise. It is the perceptually correct target for a large reverberant space, and it was found by ear before anyone could explain why it worked.
The “X” in X-curve stood for “Experimental.” Allen himself noted in his SMPTE paper that this label “now seems inappropriate for something that’s been a national and international standard for 30 years.” It became ISO 2969 in 1977 and SMPTE 202M in 1978. It has been the foundation of cinema audio calibration ever since.
So the next time a technician tells you they are going to tune the cinema flat because the Smaart trace looks better that way — tell them about Ioan Allen standing in the Elstree dubbing theatre in 1971, listening to Stanley Kubrick's film, and discovering with his ears what no analyzer had yet been able to tell him. The X-curve is what cinema sound is supposed to look like on a graph. Flat is not the target. Flat is a mistake.
One more critical nuance that Allen himself emphasizes: the 3 dB per octave slope is not a rigid fixed target — it is the center line of a tolerance band that scales with room size. Smaller rooms, with shorter reverberation times, should be calibrated to a shallower slope — closer to 2 dB per octave. Very large rooms need a steeper slope. Allen has noted that listening tests at Radio City Music Hall found that 3.5 dB per octave worked better in that enormous space. This room-size scaling is codified in SMPTE 202M as a correction table based on seat count — and it is the reason that a calibration that sounds perfect in a 150-seat auditorium will sound dull and lifeless if you apply the same curve to a 600-seat house. Know your room. Scale your target accordingly.
The modern tools I have described in this article will help you find problems you could not see before. They will help you fix those problems with precision you did not have before. But they are still just tools. The judgment call — does this cinema sound the way it should sound for the audience sitting in these seats watching this movie — that judgment belongs to you. It always has. It always will.
When the measurements are done and the corrections are made, close the laptop. Put the measurement mic back in the case. Pull up a known, dynamic test DCP — something with a full range of content, dialogue, music, and effects at reference level. Sit in the middle of the house, not the back corner where you always stand. And listen. Not to the system. To the movie. If the movie sounds right, you are done. If something is still bothering you, go find it. The analyzer will help you find it. But your ears are the ones who noticed it.
No piece of software has ever walked out of a cinema and said that was a great movie. No measurement trace has ever made an audience laugh, or cry, or hold their breath. That is what we are here for. The tools help us get there. They do not get us there by themselves.
The Modern Cinema Measurement Workflow
- Start with pink noise. Use it to set reference levels, verify signal path integrity, and confirm all channels are active. This is the baseline — not the finish line.
- Use the right microphone — and use it correctly.
This sounds obvious, but it is one of the most common mistakes in cinema calibration. Let me break this down, because there are actually three things to get right: the microphone type, the calibration file, and the orientation.
Microphone Type: Random Incidence. There are three types of measurement microphones — free-field, pressure, and random incidence. In a cinema, you are in a highly reverberant environment where sound arrives at the microphone from all directions simultaneously: direct sound from the speakers, reflections off the walls, ceiling, floor, and seats. A random-incidence (also called diffuse-field) microphone is specifically designed for exactly this environment. Its frequency response is calibrated to be flat when sound is arriving equally from all directions at once. SMPTE 202M is explicit on this: use an omnidirectional microphone calibrated for random incidence, not free-field response. A free-field microphone is designed to compensate for the acoustic shadow it casts when a sound source is directly in front of it — that correction is completely wrong in a diffuse reverberant field, and will give you a reading that appears several dB too high at upper frequencies. The result: you cut the highs, the room sounds dull, and you wonder why it still does not sound right.
Does it have to be expensive? No. You do not need a Brüel & Kjær laboratory reference microphone to calibrate a cinema. The dbx RTA-M is an omnidirectional back-electret condenser measurement microphone that sells for around $99. It covers 20 Hz to 20 kHz, runs on phantom power, and works perfectly well with both Smaart and REW. It is not the most accurate microphone on the planet, but for cinema B-chain calibration it is more than adequate — and it is a significant step up from whatever is in the junk drawer in the booth.
Calibration Files. Every measurement microphone has small individual deviations from a perfectly flat response. A calibration file (.cal or .txt) contains the measured frequency response of your specific microphone, and both Smaart and REW can load this file and apply it as a correction curve to all measurements automatically. The result is that what you see on screen is the room response — not the room response plus your microphone's quirks. One note on the RTA-M specifically: dbx does not provide individual per-unit calibration files for the RTA-M. A generic class calibration file representing the average response of the model is available from third-party sources and is widely used. For the most accurate results, a per-unit calibration from a laboratory service is preferred, but the generic file is a meaningful improvement over no calibration at all.
Orientation: Point It Straight Up. This is the one that surprises people. For a random-incidence measurement in a diffuse field, the correct orientation is 90 degrees — capsule pointing straight up at the ceiling. Do not point it at the screen. Do not aim it at the speaker cluster. Point it straight up. The reason is that a random-incidence microphone is designed to receive sound equally from all directions in the horizontal plane, and pointing it straight up achieves that geometry in a cinema.
This 90-degree orientation applies to both of your primary cinema measurements — setting the 85 dB reference level with pink noise and running your frequency response sweep for EQ. In both cases you are measuring the integrated room response, not the on-axis output of a single speaker. That is what the audience hears, and that is what you should be measuring.
Critical note on calibration files and orientation: Both Smaart and REW allow you to load a calibration file and specify the measurement orientation. The dbx RTA-M's frequency response is slightly different at 90 degrees compared to 0 degrees on-axis — particularly in the upper frequencies. If you load a 0-degree (on-axis) calibration file but use the mic pointed straight up, you will introduce a measurement error of a few dB at the top of the band. Make sure you are loading the 90-degree version of your calibration file. If you are downloading a generic class calibration file for the RTA-M from a third-party source, confirm it is labeled for 90-degree use. The wrong mic, pointed the wrong way, with the wrong calibration file loaded, is not a measurement — it is a very expensive, very confident guess.
- Use swept sine for room analysis. Run a full Smaart or REW impulse response measurement to identify room modes, nulls, phase problems, and decay characteristics at high resolution. This is where you find the real problems. If your installation uses Dolby Atmos auto-EQ, that system already performs a swept-sine-based measurement sequence automatically — and it translates remarkably well from the studio mix room to the theatre. For non-Dolby systems, Smaart and REW give you the same quality of measurement data with full manual control, the ability to see exactly what the auto-EQ saw, and the freedom to make informed decisions about what to correct and what to leave alone. Either way, the principle is the same: high-resolution swept sine measurement gives you information that pink noise simply cannot.
- Fix problems with Parametric EQ — cuts only. Use the PEQ built into your cinema processor to surgically address the specific problems the swept sine revealed. Cut the problems; do not boost the gaps. Boosting destroys headroom.
- Verify with a test DCP. After all corrections are made, play a known, dynamic test DCP at reference level. Listen critically. The measurement told you what to fix; your ears confirm whether the fix worked.
- Trust your ears for the final call — and know the limits of EQ. No analyzer makes the final judgment. You do. If it measures right but sounds wrong, keep working. If it sounds right, you are done. One important caveat: no amount of good EQ — or bad EQ — can fix distortion caused by under-powered amplifiers or old and damaged loudspeakers. If the system sounds distorted and your EQ is clean, check the amps and the drivers before you touch another filter. EQ corrects room problems. It does not resurrect hardware.
Modernize your tools. Download REW — it is free. Get a Smaart license. Learn the swept sine workflow. Start using the parametric EQ that is already in your cinema processor. These tools will show you things about your rooms that you have never been able to see before, and they will let you fix those things with a precision that a 31-band GEQ can never match. You will spend less time in the rack room and more time actually listening to the results. That is a good trade.
But do not make the mistake of thinking that better tools make you a better listener. They make you a better diagnostician. The listening part is still on you. It has always been on you. The audience does not care what your Smaart trace looks like. They care whether the movie sounds the way it was meant to sound. That is the job. The tools just help you do it better.
The ultimate analyzer is still attached to the sides of your head. Forty years of cinema experience is a pretty good calibration curve.
References
- Listen, Inc. "Audio Test Stimuli." Listen, Inc. Technical Library. https://www.listeninc.com/resources/technical-notes/audio-test-stimuli/
- Lawrence, M. / Rational Acoustics. "Audio Analyzers: Pink Noise vs Sine Sweep." Sound Design Live. https://www.sounddesignlive.com/audio-analyzers-pink-noise-vs-sine-sweep/
- DeLoria, K. "Analyze This: The Evolution of the Audio Analyzer." ProSoundWeb, September 12, 2023. https://www.prosoundweb.com/analyze-this-the-evolution-of-the-audio-analyzer-2/
- Farina, A. "Simultaneous Measurement of Impulse Response and Distortion with a Swept-Sine Technique." AES 108th Convention, 2000.
- Collins, M. F. (2026). The Headroom Illusion: Why Boosting EQ Destroys Cinema Sound. Collins Theatre Systems LLC.
- Allen, I. (2006). "The X-Curve: Its Origins and History — Electro-Acoustic Characteristics in the Cinema and the Mix-Room, the Large Room, and the Small." SMPTE Motion Imaging Journal, July/August 2006. http://jimmy.thomas.free.fr/DOC/Xcurve/Dolby_The%20X-Curve__SMPTE%20Journal.pdf